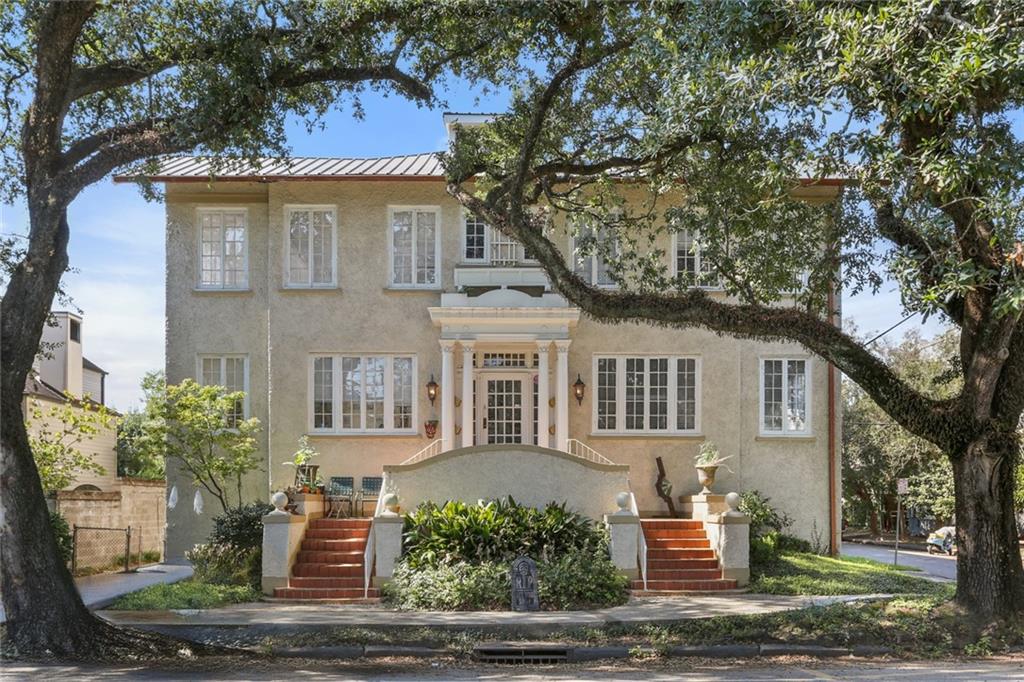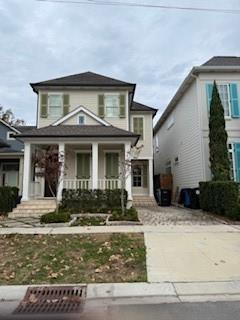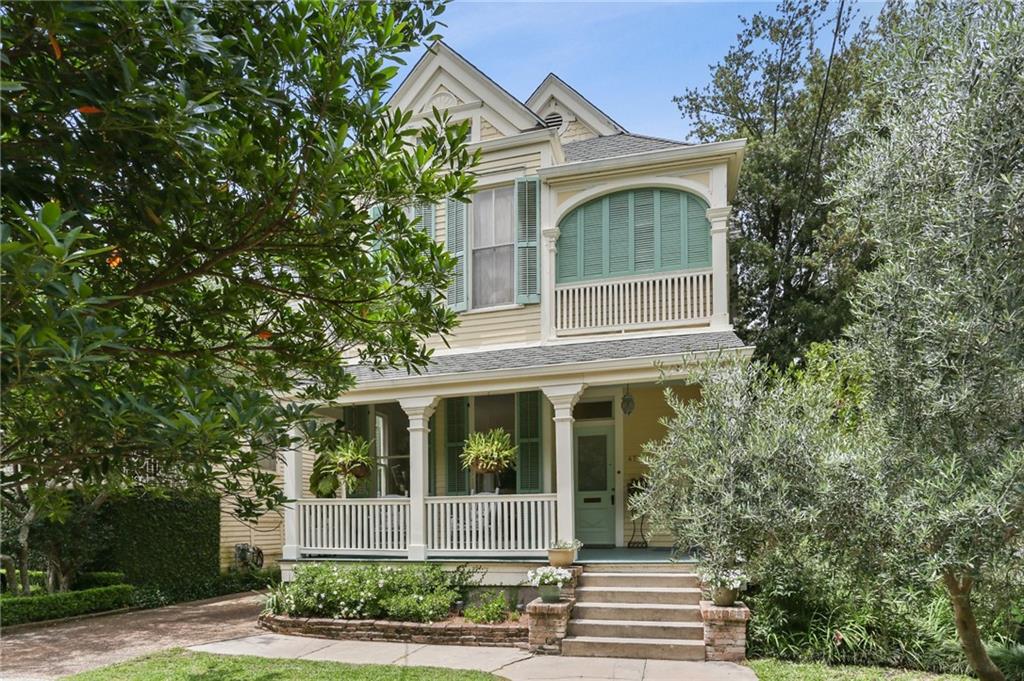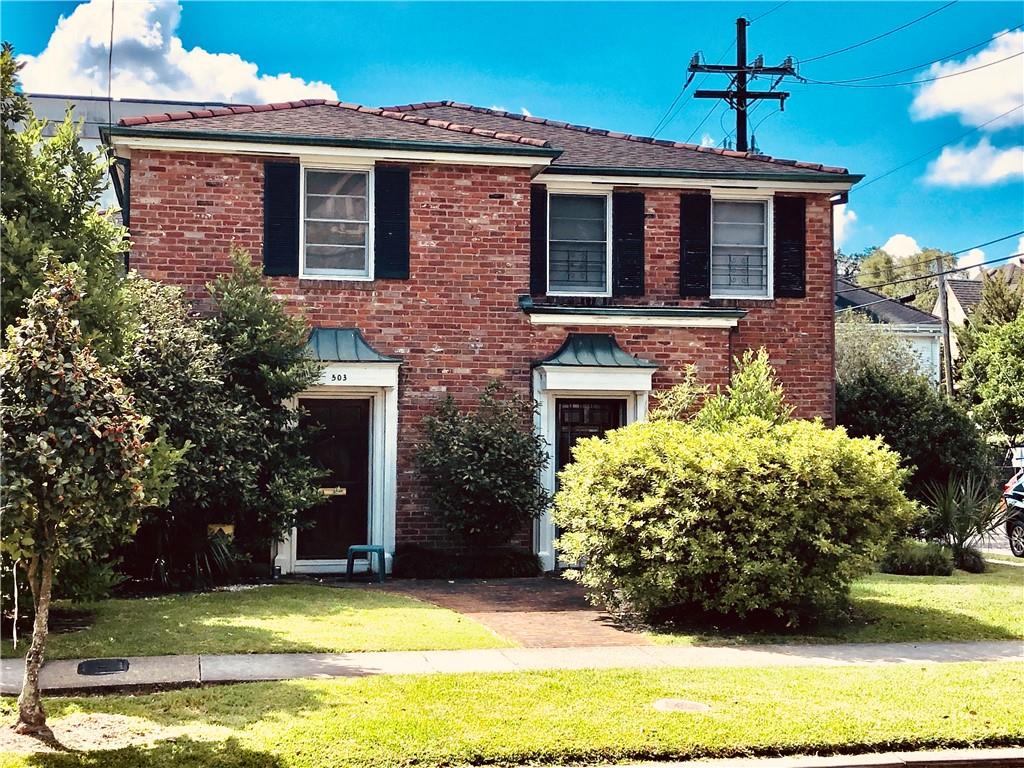
Explore Uptown New Orleans Real Estate Opportunities
29.9437° N, 90.1217° W
2,441 people live in Uptown New Orleans, where the median age is 36 and the average individual income is $67,038. Data provided by the U.S. Census Bureau.
Total Population
Median Age
Population Density
Average individual Income
There's plenty to do around Uptown New Orleans, including shopping, dining, nightlife, parks, and more. Data provided by Walk Score and Yelp.
Explore popular things to do in the area, including Da Weenies, Derbigny Food Store, and Super Witch Ice Cream.
| Name | Category | Distance | Reviews |
Ratings by
Yelp
|
|---|---|---|---|---|
| Dining | 3.49 miles | 5 reviews | 5/5 stars | |
| Dining · $ | 4.59 miles | 10 reviews | 4.7/5 stars | |
| Dining | 3.19 miles | 3 reviews | 5/5 stars | |
| Dining · $$ | 3.86 miles | 435 reviews | 4.5/5 stars | |
| Dining · $$ | 3.95 miles | 1111 reviews | 4.5/5 stars | |
| Dining | 3.22 miles | 5 reviews | 4.4/5 stars | |
| Dining · $$ | 4.38 miles | 18 reviews | 4.4/5 stars | |
| Dining · $$ | 4.18 miles | 242 reviews | 4.4/5 stars | |
| Shopping | 3.38 miles | 7 reviews | 5/5 stars | |
| Shopping | 4.51 miles | 24 reviews | 4.9/5 stars | |
| Active | 4.11 miles | 371 reviews | 4.7/5 stars | |
| Nightlife | 4.5 miles | 21 reviews | 5/5 stars | |
| Nightlife | 4.26 miles | 8 reviews | 4.9/5 stars | |
| Nightlife | 4.33 miles | 6 reviews | 4.7/5 stars | |
| Nightlife | 4.3 miles | 51 reviews | 4.6/5 stars | |
| Nightlife | 2.12 miles | 16 reviews | 4.6/5 stars | |
| Nightlife | 4.13 miles | 3 reviews | 5/5 stars | |
| Beauty | 3.79 miles | 10 reviews | 5/5 stars | |
| Beauty | 3.39 miles | 4 reviews | 5/5 stars | |
| Beauty | 2.48 miles | 11 reviews | 4.7/5 stars | |
|
|
||||
|
|
||||
|
|
||||
|
|
||||
|
|
||||
|
|
Uptown New Orleans has 980 households, with an average household size of 2. Data provided by the U.S. Census Bureau. Here’s what the people living in Uptown New Orleans do for work — and how long it takes them to get there. Data provided by the U.S. Census Bureau. 2,441 people call Uptown New Orleans home. The population density is 10,523 and the largest age group is Data provided by the U.S. Census Bureau.
Total Population
Population Density Population Density This is the number of people per square mile in a neighborhood.
Median Age
Men vs Women
Population by Age Group
0-9 Years
10-17 Years
18-24 Years
25-64 Years
65-74 Years
75+ Years
Education Level
Total Households
Average Household Size
Average individual Income
Households with Children
With Children:
Without Children:
Blue vs White Collar Workers
Blue Collar:
White Collar:

200 Broadway St New Orleans LA 70118
200 Broadway St New Orleans LA 70118